SpeckleDirStat.
- speckle
- data-viz
- hackathon
- 3d
TLDR
Deliverables
- A treemap visualization of object weight in a Speckle stream
- Branch-splitting to clean up model streams
- First place at the Speckle Hackathon 2022
Summary
An interactive visualization of the "weight" of every object in a Speckle stream — like WinDirStat for 3D models. First place at the Speckle Hackathon 2022.
Role
Developer, designer · May 2022
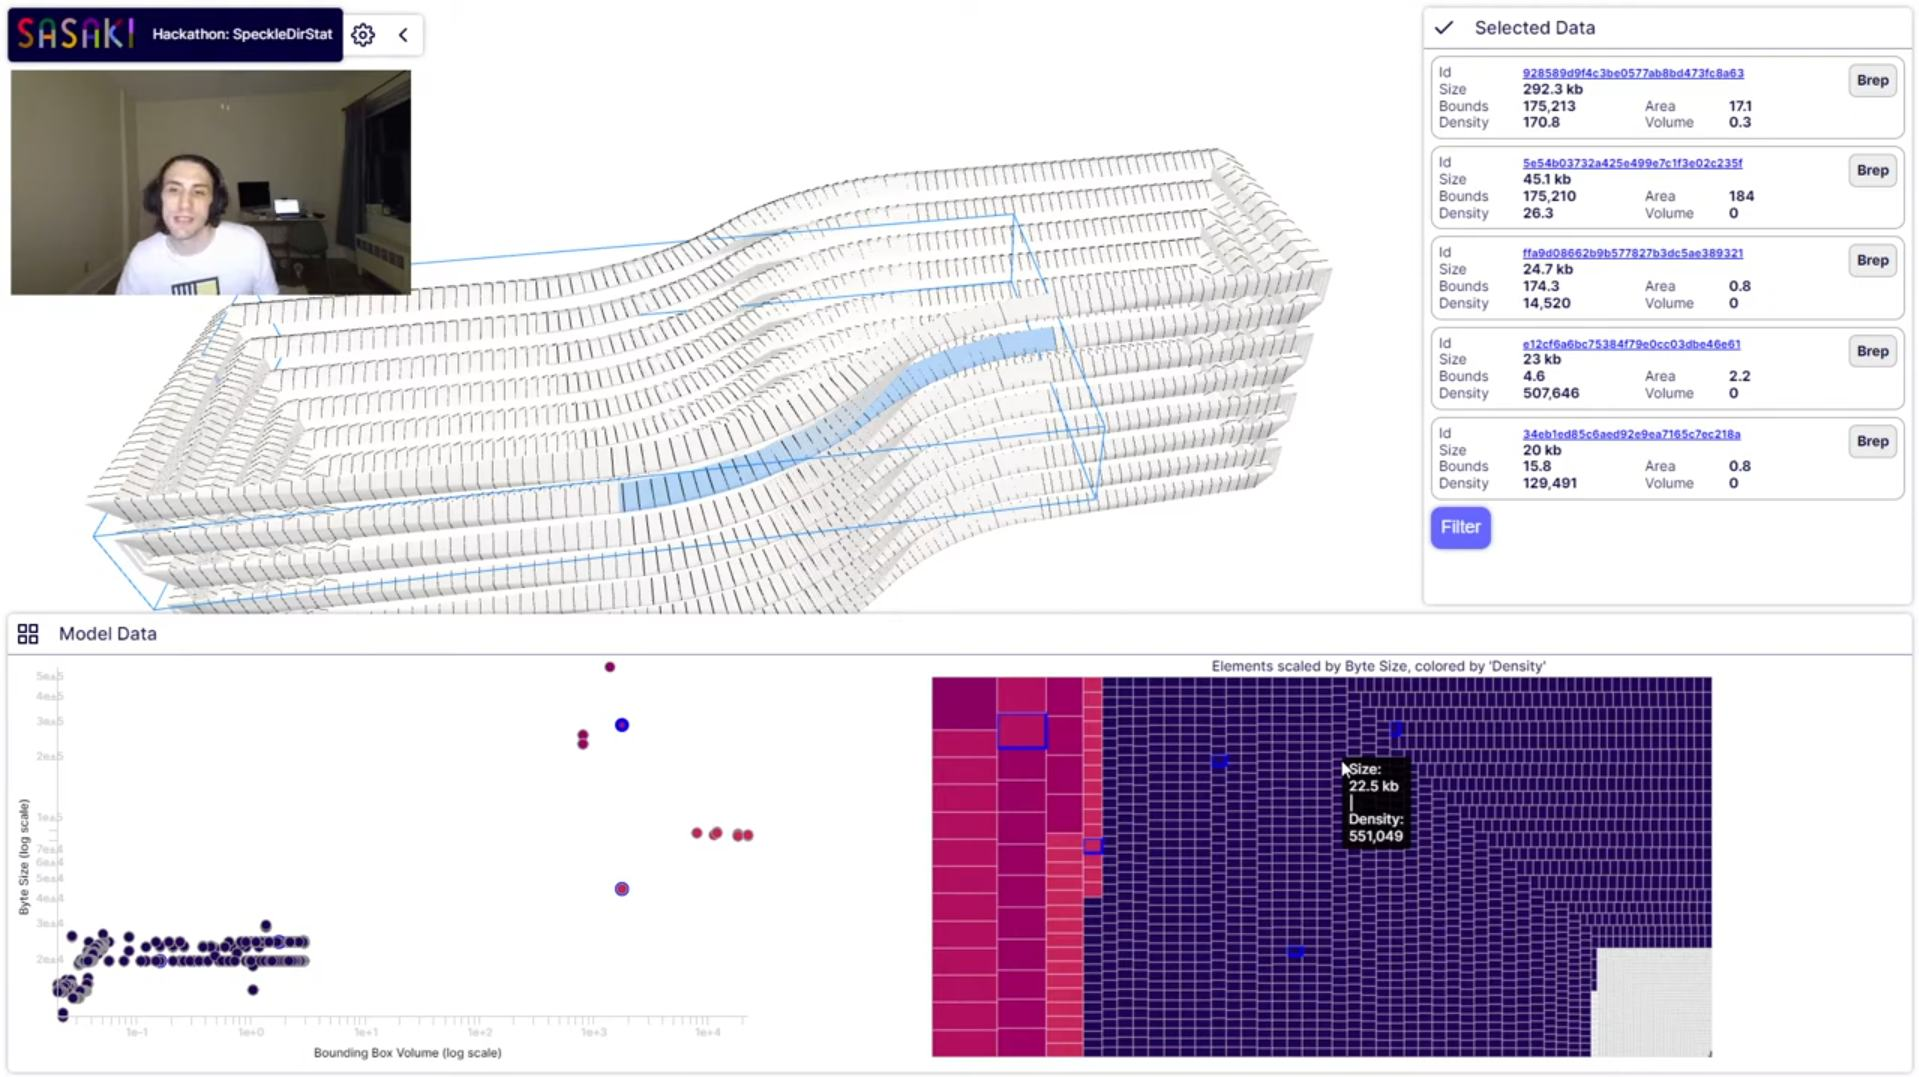
SpeckleDirStat is an interactive visualization that lets any user understand the weight of each object within a Speckle stream. Objects can be separated out into different branches to clean up a model stream — much like WinDirStat does for files on a disk.
This submission was awarded first place at the Speckle Hackathon 2022.
How it worked
The dashboard maps geometry size to a treemap, making it obvious which objects dominate a stream. Selecting regions of the treemap highlights the corresponding geometry in the model view.